
Reseller Landscape
The federal VAR market, mapped.
A competitive map of the federal IT reseller and VAR market — about 115 firms positioned by defense share against product-versus-services mix, sized by dollars. Click any firm for its profile: closest competitors, line card, agency mix, and the gaps between it and those competitors.
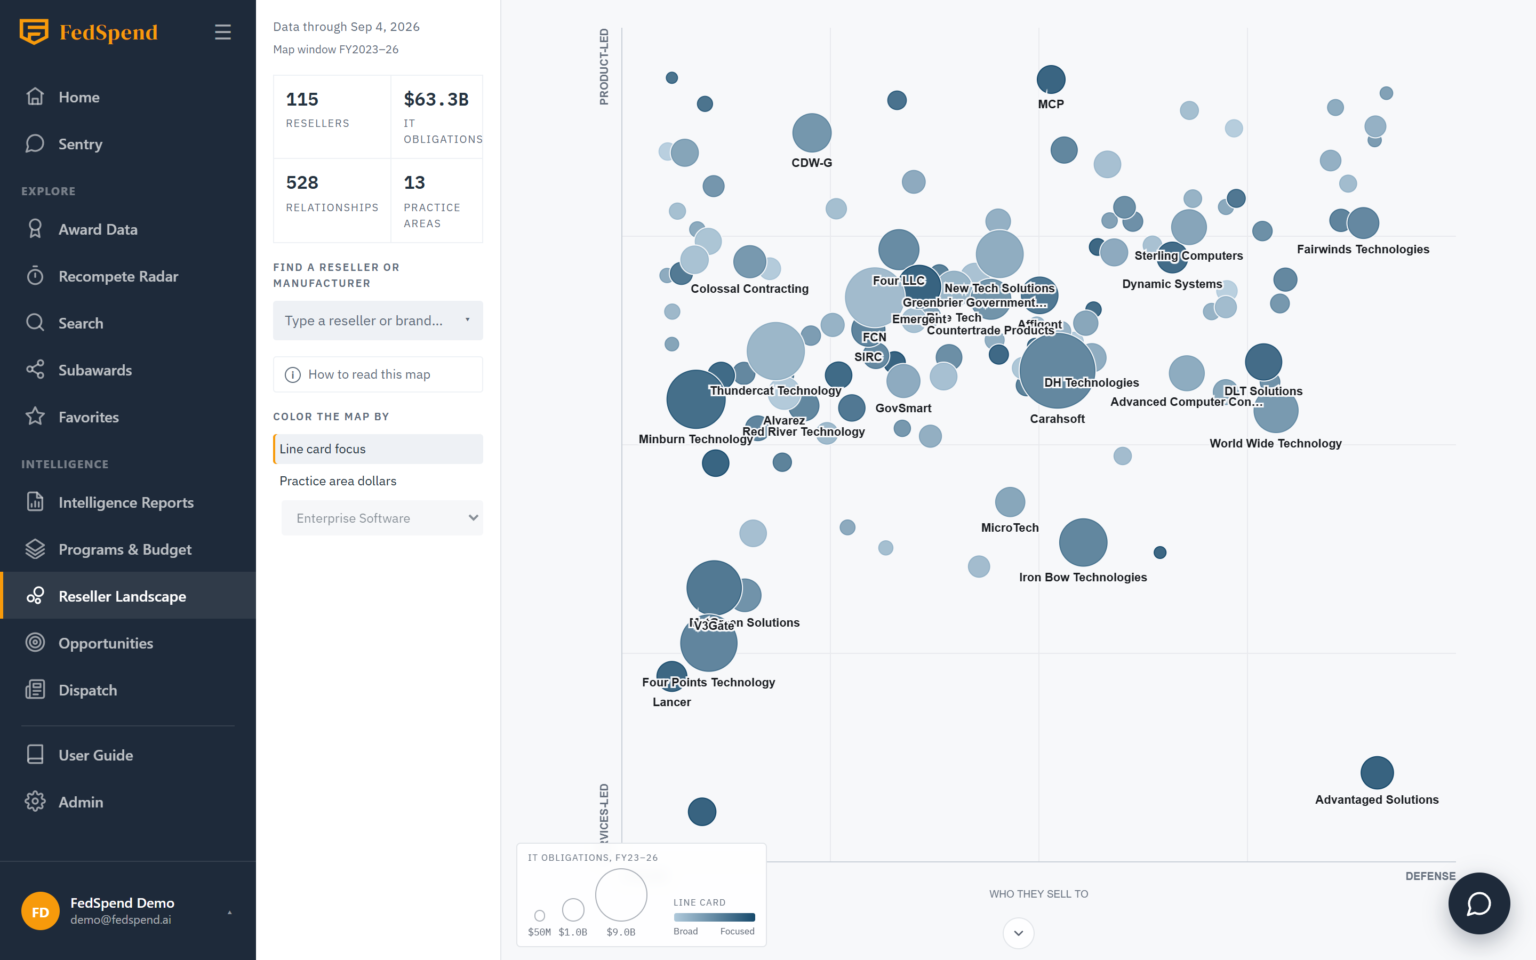
The overview map, colored by line-card focus — who they sell to across the bottom, what they sell up the side.
~115
Resellers Mapped
$63B+
IT Obligations, FY2023–26
~160
Manufacturer Brand Pages
13
Practice Areas
Firm Profiles
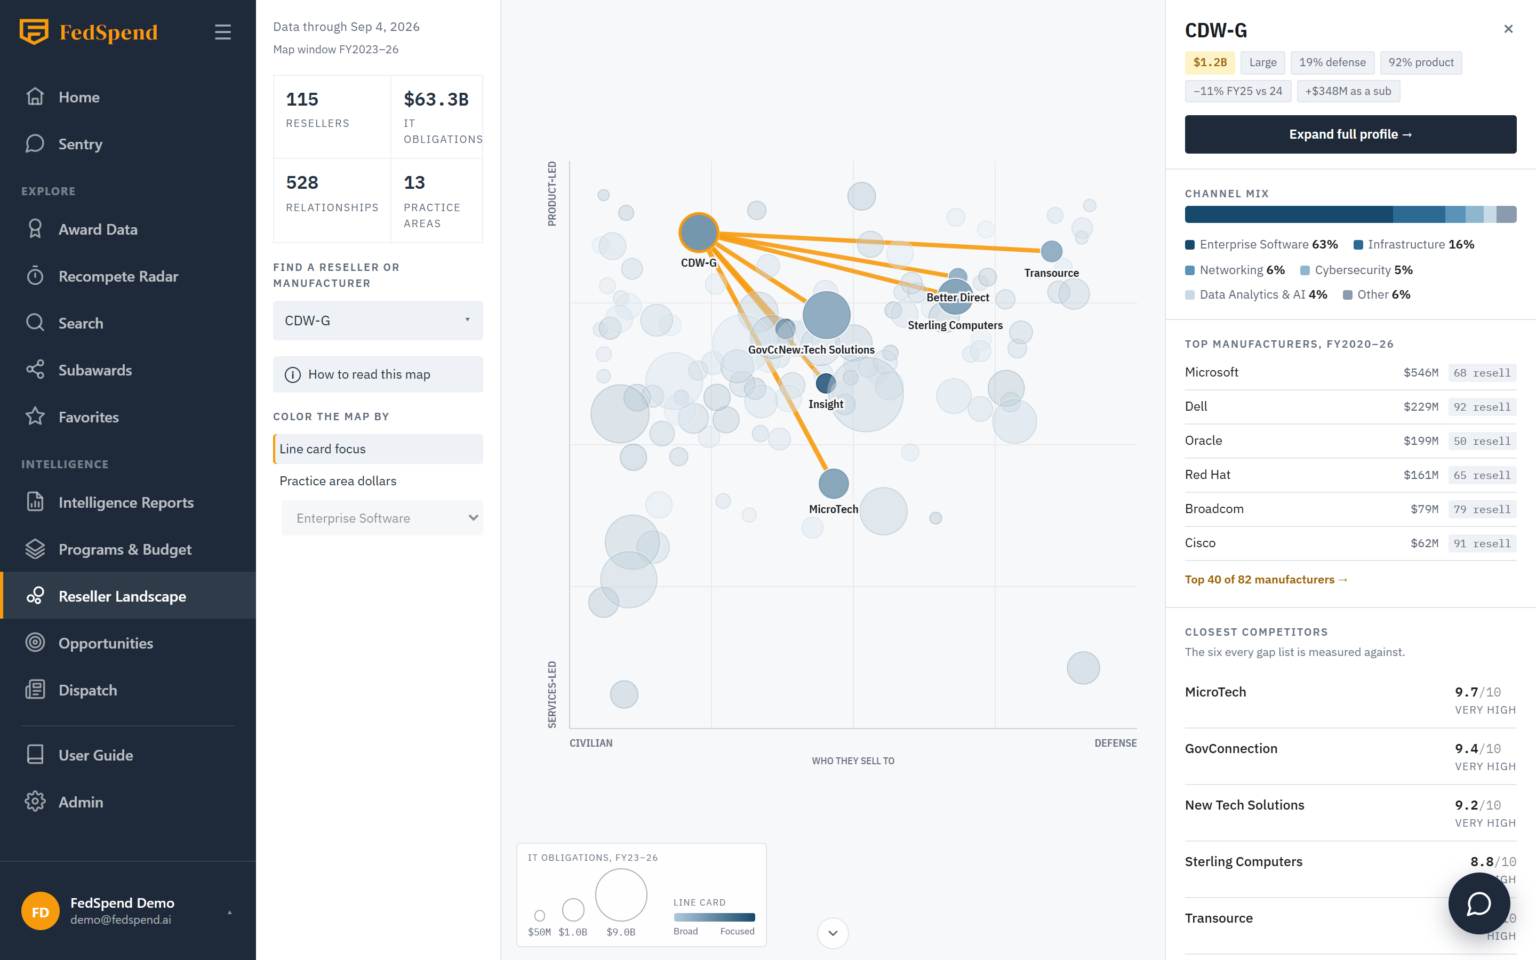
Six closest competitors — and the gaps between you.
Every firm gets a profile: overview, channel mix, top manufacturers, and a competitors tab that names its six closest peers with the line-card and agency gaps separating them. Whitespace isn’t a hunch anymore — it’s a tab.
- ▸ Color the map by book concentration or a specific practice area
- ▸ Ranked table view with FY25-vs-24 momentum
- ▸ ~160 brand pages: who resells each manufacturer, and where
For Resellers
See exactly who you’re up against, where their book is concentrated, and which brands and agencies they hold that you don’t.
For OEMs
Every brand page shows who resells you — and who resells your competitors — agency by agency. Channel strategy from evidence, not anecdotes.
For Capture Teams
Scouting a teaming partner? Filter the map to the practice area and agency you need, sized by real FY2023–26 dollars.
Nobody else maps this market.
The Reseller Landscape is a Strategy-plan module, refreshed with the monthly data cycle.