


- Small vendors lose to primes on data access, not headcount
- Self-serve spend tools can replace a full analyst function
- Agency spend trends reveal opportunity before solicitations post
- Air Force IT obligations rose roughly 16% over two fiscal years
- Category-level growth signals expose winning opportunities early
A five-person capture team at a $2 billion prime spends its week doing something a solo BD hire at a 40-person IT shop cannot afford to replicate: pulling agency obligations data, cross-referencing PSC codes, and flagging which contracts are about to recompete. That team costs more in salary alone than most small vendors spend on their entire sales function in a year. The assumption baked into most federal BD advice is that small vendors lose to primes because they lack headcount. That’s backwards. They lose because they lack the same view into where the money is actually moving — and headcount was never the only way to get it.
Fix the visibility gap and the headcount gap stops mattering nearly as much.
The BD Department You Don’t Have (And Why That’s Okay)
Most small IT vendors run federal sales with one or two people, not a department. There’s no dedicated capture manager, no market research analyst, no competitive intelligence function sitting between the CEO and the next proposal. Everyone on the team is also the person who answers support tickets or manages the AWS bill.
Large primes built around a different model: analysts who track agency spend trends full time, capture managers who own the pipeline, and researchers who monitor incumbent contracts down to the expiration date. That infrastructure is expensive, and it exists because primes chase nine-figure programs where a wrong bet costs millions. Here’s the table that gets skipped in most “how to compete with primes” advice:
Capture Function How a Prime’s Team Does It What a Small Vendor Needs Instead Agency spend tracking Dedicated analyst pulling FPDS/USASpending extracts weekly Self-serve dashboard, no analyst required PSC/NAICS breakdown Custom reports built by a research team Pre-built agency-level PSC and NAICS views Incumbent contract tracking Capture manager monitoring recompete calendars Automated expiration alerts Competitive intelligence Market research staff mapping competitor wins Vendor and award lookups on demand
The right side of that table doesn’t require a new hire. It requires a different tool.
What Large Primes Do That Small Vendors Can’t Afford to Replicate
Primes don’t just have more people — they have people whose entire job is watching the data small vendors never see. A capture manager at a top-20 IT prime spends a chunk of every quarter tracking which agencies are shifting budget toward cloud migration versus legacy application support, which PSC categories are growing, and which incumbents are approaching the end of their period of performance.
The Staffing Math Doesn’t Work for a 40-Person Shop
That function typically requires multiple full-time salaries stacked on top of an enterprise capture platform subscription — the kind built for teams that log in every day, not for someone checking spend data between client calls. A vendor trying to mirror that setup with one analyst and a spreadsheet isn’t behind on tools. They’re behind on math.
The smarter move isn’t hiring a junior analyst to imitate the prime playbook part-time. It’s finding every vendor already selling into a target agency and reverse-engineering the same intelligence a capture team would compile, through a vendor-mapping approach built for exactly that question, without the headcount.
The Real Cost of Limited Research Time
Every hour a sales rep spends manually digging through USASpending.gov is an hour not spent on a live prospect. That’s the actual cost, and it’s not abstract. It’s the proposal that didn’t get written and the discovery call that didn’t get scheduled.
Manual research also misses patterns that only show up when you can see a full agency trend line, not a single data point. An agency quietly growing its network support obligations for two straight years is a signal. A vendor who only checks a solicitation site when it drops a new RFP never sees that signal coming — they just see the RFP, alongside every other bidder who found it the same day.
There’s a second cost most small vendors ignore entirely: the crowded end of the market isn’t where the openings are. Tail spend below the headline contract vehicles is where a lot of small-vendor opportunity actually sits, and it’s invisible if your only research method is watching for big solicitations.
Explore $492B in federal IT spend
Try FedSpend free for 14 days. Full dashboard access, no credit card required.
How Self-Serve Spend Visibility Replaces an Analyst
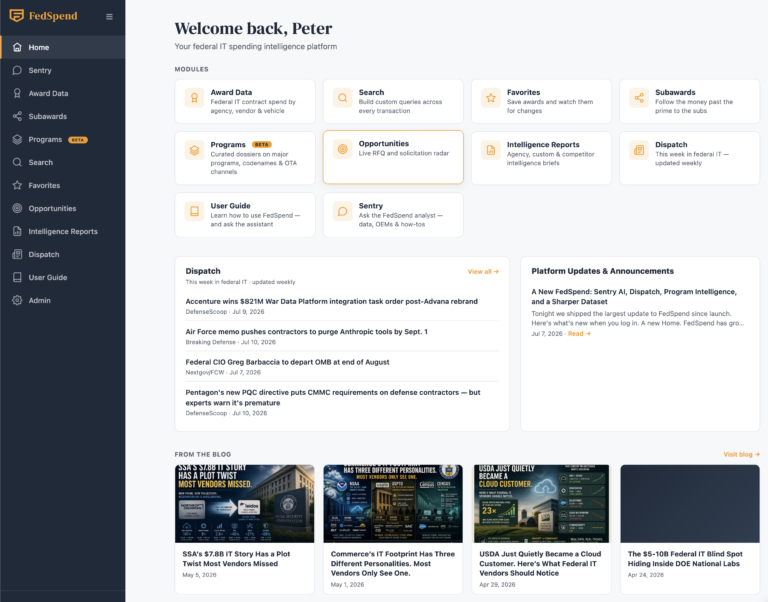
Self-serve spend data gives a small vendor the same starting point an analyst would hand a capture manager — agency obligations, top PSCs, and top NAICS codes, without waiting on a report. Instead of a week of research compiled into a slide deck, the vendor pulls the view directly.
FedSpend’s agency-spend dataset, as of September 1, 2026, illustrates the kind of trend line this replaces. Look at the Department of the Air Force’s IT obligations across three fiscal years:
Fiscal Year Total IT Obligations Transactions Top PSC Category Top NAICS Category FY2025 $12.01B 22,460 DA01 – App Dev Support (Labor) 541512 – Computer Systems Design FY2024 $11.29B 22,133 DA01 – App Dev Support (Labor) 541512 – Computer Systems Design FY2023 $10.38B 21,860 DA01 – App Dev Support (Labor) 541512 – Computer Systems Design
That’s a two-year climb of roughly 16% in total obligations, with 541512 Computer Systems Design Services obligations alone rising from $1.51 billion to $2.40 billion over the same window — a single NAICS code growing faster than the agency’s overall IT budget. A capture analyst would need days to assemble that trend by hand. On a spend platform built to surface agency obligations directly, it’s a lookup. The same kind of trend detection is what’s driving broader interest in machine-learning-assisted procurement analysis across the industry — the underlying job is pattern-spotting, and software is simply faster at it than a person with a spreadsheet.
A Practical Example: Sizing Up an Agency in Minutes
Sizing up an agency doesn’t require a capture team when the data structure does the sorting for you. Here’s the sequence a small vendor can actually run in one sitting:
- Pull the agency’s total obligations for the last two to three fiscal years to see the overall direction.
- Check the top PSC codes to identify which service categories dominate the spend.
- Check the top NAICS codes to confirm which vendor categories are winning that work.
- Compare year-over-year change within a single PSC or NAICS code, not just the agency total.
- Flag any category showing outsized growth relative to the agency’s overall trend.
Run that sequence against the Department of the Navy and a specific signal appears fast: total Navy IT obligations grew about 5% from FY2024 to FY2025, moving from $9.56 billion to just over $10.07 billion. But its DA01 application-development-support category grew roughly 23% in the same period, from $1.63 billion to just over $2 billion. That’s a category outrunning the agency’s own budget growth by a wide margin — exactly the kind of gap recompete-tracking research is designed to catch before an RFP ever posts. A capture analyst would compile this manually. A small vendor gets there in minutes.
Choosing Tools That Fit a Small Team’s Budget and Bandwidth
The right tool for a small vendor isn’t the most comprehensive one — it’s the one that doesn’t require training to use. Enterprise capture platforms built for primes assume a staff to operate them: someone building custom reports, someone maintaining the CRM sync, someone justifying the license cost to finance.
A small vendor should look for:
- Self-serve access with no sales-led onboarding required
- Clear obligations data broken out by agency, PSC, and NAICS
- No multi-month implementation cycle
- Transparent, predictable pricing instead of a custom enterprise quote
The goal is speed and clarity, not an analyst-grade report nobody has time to read. Vendors comparing options often end up weighing platform depth against actual usability — a question a direct platform comparison answers more honestly than either vendor’s marketing page.
Competing With Primes Without Their Headcount
Spend visibility, not staff size, is what actually closes the gap between a small vendor and a resource-heavy prime. A prime’s advantage was never the org chart. It was the information the org chart existed to produce.
Give a one-person BD team the same obligations data, the same PSC trend lines, the same incumbent-expiration signals, and the advantage shrinks fast. What’s left is agility — and a small team, unburdened by five layers of capture review, usually moves faster once it can see what it’s chasing.
The Data Was Always Public. The Advantage Was Access.
None of this required a bigger team. It required refusing to accept that federal BD infrastructure is a prime-only luxury. The government’s spending data has been sitting in FPDS and USASpending.gov the entire time — the primes just had people paid to extract it faster than everyone else. Close that access gap and the headcount gap stops being the story. A vendor that reads agency spend trends correctly, twice a quarter, will out-target a five-person capture team that’s still waiting on last month’s report.
