


Federal IT spending data is technically public. Functionally, it’s invisible. The government pushes billions of transaction-level records into USASpending.gov, FPDS, and agency budget justifications every year, and yet a procurement analyst trying to answer a straightforward question — how much did this agency actually spend with this vendor last year, and on what? — will spend a day stitching CSVs together before getting a number they trust. That gap between “published” and “usable” is the entire reason FedSpend exists.
What is FedSpend and why does it exist?
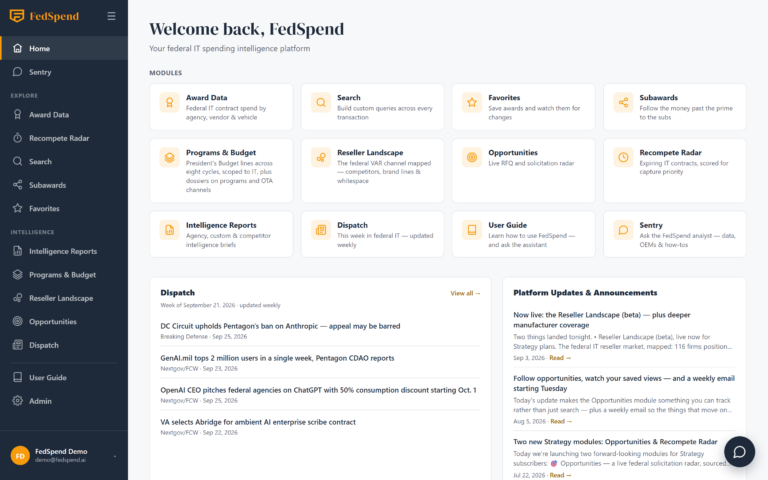
FedSpend is a federal IT spending intelligence platform that turns fragmented procurement records into decision-ready analysis on agencies, vendors, and contract vehicles.
The raw material is public. USASpending.gov and the Federal Procurement Data System expose award-level detail down to individual transactions. But raw material is not intelligence. A CSV with 400 columns and inconsistent vendor names is a research problem, not an answer. FedSpend’s job is to close the last mile — vendor rollups that actually roll up, agency profiles that account for sub-bureau structure, and vehicle-level views that show who really owns a ceiling versus who just holds a task order.
The difference matters most when a vendor has doubled its footprint inside an agency over eighteen months and no press release, no budget justification, and no USASpending dashboard flagged it.
Why is federal procurement data so hard to interpret?
Because the data is scattered across at least four systems, coded inconsistently at the source, and rarely joined the same way twice.
Every “top contractor” list and federal IT trend line you’ve ever read was built on data that a plurality of required agencies could not certify was complete. GAO’s 2025 audit (GAO-25-107469) found that 34 of 70 agencies either skipped or failed to finish their FY2023 procurement data quality reports. Nineteen of 24 missed OMB’s deadline. Two couldn’t certify their data reached FPDS at all. This is not a bureaucratic paperwork gap — it is a description of the raw feed that every analyst, tool, and dashboard is working from.
The fragmentation compounds the problem. Contract awards live in FPDS. Aggregated dashboards live on USASpending. Solicitations and vendor registrations live in SAM.gov. Program-level dollar targets live in agency IT Budget Justifications and the OMB IT Dashboard. None of these systems share a common program identifier, and none of them agree on what counts as “IT.”
Then there’s the coding. Product Service Codes (PSCs) and NAICS codes are supposed to make category analysis tractable. In practice, a cloud migration task order can be booked under a D-series IT services PSC in one agency and a professional-services PSC in another. Two contracts buying the same thing come out looking like different markets. This is the mechanic behind our breakdown of Commerce’s three-personality IT footprint, where NIST, NOAA, and Census book similar work under wildly different codes and vendor rollups miss half the picture.
When a single vendor books $129M obligated against a $144M ceiling — roughly 4% of USDA’s annual IT budget — through a handful of modifications in under twelve months, that concentration pattern doesn’t exist in the raw feed until someone joins transaction records to vehicle ceilings to parent-entity rollups. That is exactly the reconstruction we walked through in the $144M USDA-Palantir contract breakdown. Nothing about that analysis is impossible from the raw data. It’s just impractical without infrastructure — and that reconstruction, joining modifications to parent-entity rollups to vehicle ceilings, is precisely what agency contracting shops should be doing in real time. The ones with the infrastructure to do it are not the majority.
Explore federal IT spending patterns free
Start a FedSpend trial to discover growth opportunities in $675B+ of federal IT awards.
Key features of the FedSpend platform
The platform is organized around four workflows: vendor tracking, agency trajectory, contract vehicle intelligence, and cross-agency comparison.
Vendor-level spend tracking
Concentration risk doesn’t appear in agency press releases. It appears in transaction sequences — and the Palantir-USDA reporting arc is the working proof of what you miss when you only read the award announcement. The playbook analysis on how Palantir won the USDA direct deal pairs with the worst-case read on $300M of vendor lock-in risk, both built from the same underlying transaction feed most analysts see as noise.
Agency budget trajectory analysis
The distance between what agencies put on the IT major-investments list and what they actually deliver is the most reliably ignored number in federal technology policy — and it only becomes visible when you track budget justifications alongside obligation flows over time. According to the federal IT dashboard, agencies will spend about $102B on IT in FY2025 — a sum larger than the combined annual budgets of NASA and the National Science Foundation — with roughly $30.7B, or about 30% of the total, flagged as “major investments.” “Flagged” is doing a lot of work in that sentence: it means the projects are on a list, not that they are funded, staffed, or on schedule. The gap between the list and the delivery is where the interesting agency profiles live. A useful trajectory view answers: is this agency’s development-modernization-enhancement (DME) share growing or shrinking? Where inside the agency? For a worked example of what a full-agency profile looks like when you push past the headline, see how USDA quietly became a cloud customer in FY26.
Contract vehicle and IDIQ tracking
Every experienced federal seller knows the number that matters is not the IDIQ ceiling. It’s the actual obligation flow against that ceiling — the gap between what a vehicle can hold and what it’s currently pulling. FedSpend tracks both, so incumbents’ quiet advantages become auditable — specifically the task orders that recompete inside a friendly vehicle before any outside vendor has a chance to see the solicitation, let alone respond. This is the layer where our award data views earn their keep for competitive intelligence teams.
Cross-agency comparison
The pricing delta between agencies buying similar work is usually the most actionable number in a competitive intelligence brief — and it only exists when you run two agency profiles side by side against the same PSC/NAICS filter. When one civilian agency is paying a 40% premium over a peer for the same category of cloud-migration work, that gap is either a procurement failure or a capability difference — and the raw data won’t tell you which until you control for vehicle, vendor, and contract type. Our agency spending intelligence overview lays out how to use those comparisons without over-reading noise.
| Feature | What it answers | Primary data source |
|---|---|---|
| Vendor tracking | Who is winning, and how fast? | FPDS transactions |
| Agency trajectory | Where is this agency’s IT spend going? | USASpending + IT Dashboard |
| Vehicle / IDIQ tracking | Ceiling vs. actual obligations | FPDS IDVs |
| Cross-agency comparison | Where are the pricing and category outliers? | Joined FPDS + PSC/NAICS |
What FedSpend is not
FedSpend is not a bidding portal, a SAM.gov replacement, or a raw data mirror.
It doesn’t publish solicitations. It doesn’t help you submit a proposal. It doesn’t compete with SAM.gov’s registration workflow or USASpending’s public download interface. Those are the plumbing.
Who uses FedSpend, and how?
The useful question isn’t which reader type opens the platform — it’s what they’ve walked out with that they couldn’t have assembled from the raw feeds alone.
A capture lead at a mid-tier integrator used vehicle-level obligation data to catch that a civilian agency’s cloud modernization pipeline had already been more than half pre-allocated through an incumbent’s existing task orders before the recompete draft solicitation ever hit SAM.gov — the kind of finding that decides whether you bid or walk. A program director inside a Treasury bureau built a peer-comparison brief showing his shop was paying roughly 20% more per developer-hour than a comparable civilian PMO on the same schedule; the delta became the evidence in his next budget request. On the journalism side, the transaction-joining approach that produced the USDA-Palantir arc has surfaced quieter concentration patterns elsewhere — notably a steady VA-Oracle lean across health IT sustainment task orders that never appeared in any single award announcement because it was spread across a dozen modifications.
The bottom line on public data that isn’t really public
GAO has been writing the same finding for years, and the agencies filing incomplete data reports are still managing billions in active awards while doing it. That’s not a data-quality problem. That’s a procurement accountability problem with a known address — OMB’s oversight mandate, agency CIO shops, and the contracting officers signing modifications against ceilings no one outside the room can see — and no one in it.
